【Python】Streamlit 库:快速构建交互式 Web 应用程序

06-01 1294阅读

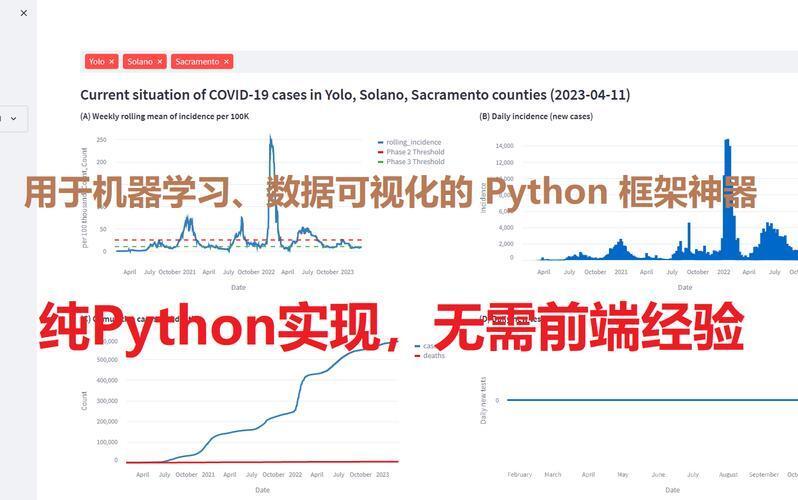
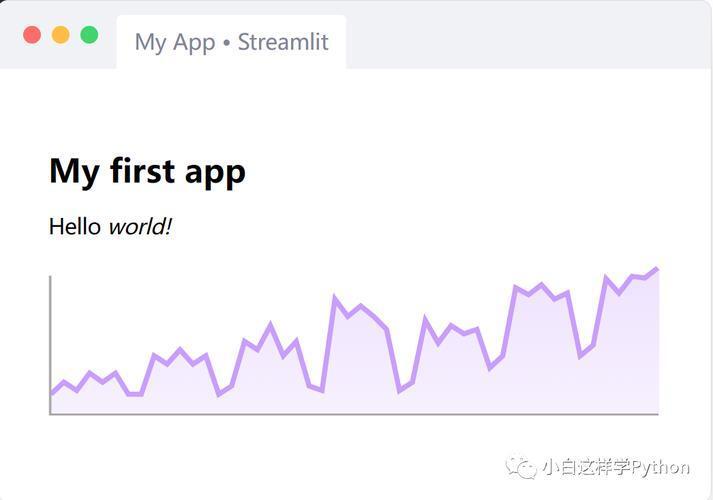
Streamlit 是一个开源的 Python 库,用于快速构建交互式 Web 应用程序,特别适合数据科学家和机器学习工程师。它以简单直观的 API 著称,允许用户通过纯 Python 代码创建数据可视化、仪表板和交互式工具,无需前端开发经验。Streamlit 应用程序可以通过浏览器访问,支持实时更新和用户交互,广泛用于数据探索、模型展示和快速原型开发。

以下是对 Streamlit 库的详细介绍,包括其功能、用法和实际应用。


1. Streamlit 库的作用

  • 快速开发:通过简单的 Python 脚本创建 Web 应用,无需 HTML/CSS/JavaScript 知识。
  • 交互性:支持输入控件(如滑块、下拉菜单、文本框)实现用户交互。
  • 数据可视化:无缝集成常见可视化库(如 Matplotlib、Plotly、Altair)。
  • 实时更新:代码修改后自动刷新页面,加速开发迭代。
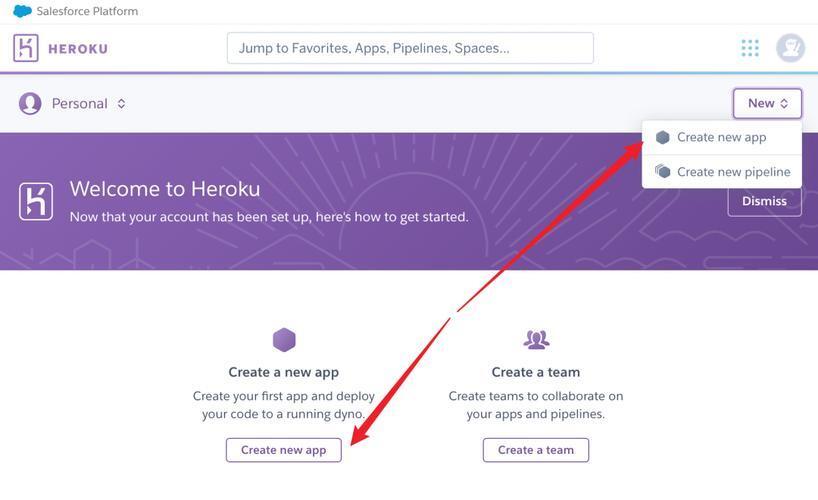
  • 部署简单:支持本地运行和云部署(如 Streamlit Community Cloud、Heroku、AWS)。

    2. 安装与环境要求

    • Python 版本:支持 Python 3.8+(推荐 3.9+)。
    • 依赖:
      • pandas:数据处理。
      • numpy:数值计算。
      • tornado:Web 服务器。
      • 可选:可视化库(如 matplotlib、plotly)。
      • 安装命令:
        pip install streamlit
        
      • 验证安装:
        streamlit hello
        
        • 运行后,浏览器会打开 Streamlit 的欢迎页面(默认 http://localhost:8501)。
        • 运行 Streamlit 应用:
          streamlit run app.py
          
          • app.py 是包含 Streamlit 代码的 Python 文件。

            3. 核心功能与用法

            Streamlit 的核心是通过 st 模块提供的函数(如 st.write、st.button)构建应用界面。以下是主要功能和示例。

            3.1 显示文本和数据

            使用 st.write、st.title 等显示内容。

            import streamlit as st
            st.title("My First Streamlit App")
            st.write("Welcome to Streamlit!")
            st.markdown("This is **bold** text with *italics*.")
            

            说明:

            • st.title:设置页面标题。
            • st.write:通用输出,支持文本、数据框、图表等。
            • st.markdown:渲染 Markdown 格式文本。
              3.2 交互控件

              支持多种输入控件,实现用户交互。

              import streamlit as st
              # 文本输入
              name = st.text_input("Enter your name", "John Doe")
              st.write(f"Hello, {name}!")
              # 滑块
              age = st.slider("Select your age", min_value=0, max_value=100, value=25)
              st.write(f"You are {age} years old.")
              # 下拉菜单
              option = st.selectbox("Choose a color", ["Red", "Blue", "Green"])
              st.write(f"Selected color: {option}")
              # 按钮
              if st.button("Click me"):
                  st.write("Button clicked!")
              

              说明:

              • 控件的值存储在变量(如 name、age),可用于动态更新。
              • Streamlit 自动重新运行脚本以反映用户输入。
                3.3 数据可视化

                集成 Pandas、Matplotlib、Plotly 等库展示数据。

                import streamlit as st
                import pandas as pd
                import plotly.express as px
                # 显示数据框
                df = pd.DataFrame({
                    "x": [1, 2, 3, 4],
                    "y": [10, 20, 25, 30]
                })
                st.dataframe(df)
                # 绘制图表
                fig = px.line(df, x="x", y="y", title="Simple Line Chart")
                st.plotly_chart(fig)
                

                说明:

                • st.dataframe:显示交互式数据表。
                • st.plotly_chart:渲染 Plotly 图表(支持 matplotlib、altair 等)。
                  3.4 文件上传

                  处理用户上传的文件(如 CSV、图片)。

                  import streamlit as st
                  import pandas as pd
                  uploaded_file = st.file_uploader("Upload a CSV file", type=["csv"])
                  if uploaded_file is not None:
                      df = pd.read_csv(uploaded_file)
                      st.write("Uploaded Data:")
                      st.dataframe(df)
                  

                  说明:

                  • st.file_uploader:支持指定文件类型。
                  • 上传文件后可直接处理(如用 Pandas 解析)。
                    3.5 缓存数据

                    使用 @st.cache_data 缓存昂贵计算,提高性能。

                    import streamlit as st
                    import pandas as pd
                    @st.cache_data
                    def load_data():
                        # 模拟昂贵操作
                        return pd.DataFrame({"col1": range(1000), "col2": range(1000, 2000)})
                    df = load_data()
                    st.write("Cached Data:", df.head())
                    

                    说明:

                    • @st.cache_data 缓存函数结果,避免重复计算。
                    • 适合加载大文件或复杂计算。
                      3.6 布局与容器

                      使用 st.columns、st.sidebar 组织界面。

                      import streamlit as st
                      # 侧边栏
                      st.sidebar.title("Settings")
                      option = st.sidebar.selectbox("Mode", ["Light", "Dark"])
                      # 列布局
                      col1, col2 = st.columns(2)
                      with col1:
                          st.write("Column 1 content")
                      with col2:
                          st.write("Column 2 content")
                      

                      说明:

                      【Python】Streamlit 库:快速构建交互式 Web 应用程序
                      (图片来源网络,侵删)
                      • st.sidebar:将控件放入侧边栏。
                      • st.columns:创建多列布局。

                        4. 性能与特点

                        • 高效开发:几行代码即可创建交互式应用。
                        • 实时更新:修改代码后页面自动刷新。
                        • 内存效率:支持缓存机制,优化大数据处理。
                        • 局限性:
                          • 不适合复杂前端逻辑(如动态 JavaScript)。
                          • 单线程运行,可能不适合高并发场景。
                          • 扩展性:通过 streamlit.components 支持自定义 HTML/JavaScript。

                            5. 实际应用场景

                            • 数据仪表板:展示数据分析结果(如销售数据、实验结果)。
                            • 机器学习演示:展示模型预测和可视化(如分类器、回归)。
                            • 交互工具:构建数据查询或过滤工具。
                            • 教育应用:创建交互式教学工具(如数学计算器)。
                            • 快速原型:验证数据产品或应用概念。

                              示例(交互式数据分析):

                              import streamlit as st
                              import pandas as pd
                              import plotly.express as px
                              st.title("Data Analysis Dashboard")
                              # 文件上传
                              uploaded_file = st.file_uploader("Upload CSV", type=["csv"])
                              if uploaded_file:
                                  df = pd.read_csv(uploaded_file)
                                  st.dataframe(df.head())
                                  # 列选择
                                  column = st.selectbox("Select column to plot", df.columns)
                                  fig = px.histogram(df, x=column)
                                  st.plotly_chart(fig)
                                  # 过滤数据
                                  threshold = st.slider("Filter threshold", float(df[column].min()), float(df[column].max()))
                                  filtered_df = df[df[column] > threshold]
                                  st.write("Filtered Data:", filtered_df)
                              

                              说明:

                              【Python】Streamlit 库:快速构建交互式 Web 应用程序
                              (图片来源网络,侵删)
                              • 用户上传 CSV,查看数据并绘制直方图。
                              • 滑块过滤数据,实时更新显示。

                                6. 部署

                                Streamlit 应用可以本地运行或部署到云端。

                                • 本地运行:
                                  streamlit run app.py
                                  
                                • Streamlit Community Cloud(推荐):
                                  1. 将代码推送到 GitHub 仓库。
                                  2. 登录 Streamlit Community Cloud(https://share.streamlit.io/)。
                                  3. 连接 GitHub 仓库,配置 app.py 和 requirements.txt。
                                  4. 部署后获取公共 URL。
                                • 其他平台:
                                  • Heroku:使用 Dockerfile 或 Procfile。
                                  • AWS EC2:运行 Streamlit 服务器。
                                  • Docker:
                                    FROM python:3.9
                                    WORKDIR /app
                                    COPY . .
                                    RUN pip install -r requirements.txt
                                    CMD ["streamlit", "run", "app.py", "--server.port=8501"]
                                    

                                    7. 注意事项

                                    • 性能:
                                      • 大型数据集可能导致页面卡顿,使用 @st.cache_data 优化。
                                      • 避免在循环中频繁调用 st 函数。
                                      • 交互限制:
                                        • 每次用户交互触发脚本重新运行,需注意状态管理(使用 st.session_state)。
                                          if "count" not in st.session_state:
                                              st.session_state.count = 0
                                          if st.button("Increment"):
                                              st.session_state.count += 1
                                          st.write("Count:", st.session_state.count)
                                          
                                        • 兼容性:
                                          • 确保可视化库(如 Plotly)版本与 Streamlit 兼容。
                                          • 最新版本(截至 2025,1.39.0)支持更多功能。
                                          • 安全性:
                                            • 云部署时,使用环境变量存储敏感信息:
                                              import os
                                              api_key = os.getenv("API_KEY")
                                              
                                            • 局限性:
                                              • 不支持复杂前端交互(如实时 WebSocket)。
                                              • 高并发需结合 WSGI 服务器(如 Gunicorn)。

                                                8. 综合示例

                                                以下是一个综合示例,展示数据上传、可视化和交互过滤:

                                                【Python】Streamlit 库:快速构建交互式 Web 应用程序
                                                (图片来源网络,侵删)
                                                import streamlit as st
                                                import pandas as pd
                                                import plotly.express as px
                                                st.title("Interactive Data Explorer")
                                                # 侧边栏设置
                                                st.sidebar.header("Options")
                                                chart_type = st.sidebar.selectbox("Chart Type", ["Line", "Scatter", "Histogram"])
                                                # 文件上传
                                                uploaded_file = st.file_uploader("Upload a CSV file", type=["csv"])
                                                if uploaded_file:
                                                    @st.cache_data
                                                    def load_data():
                                                        return pd.read_csv(uploaded_file)
                                                    
                                                    df = load_data()
                                                    st.write("Data Preview:", df.head())
                                                    # 选择列
                                                    columns = df.columns.tolist()
                                                    x_col = st.selectbox("X-axis", columns)
                                                    y_col = st.selectbox("Y-axis", columns)
                                                    # 绘制图表
                                                    if chart_type == "Line":
                                                        fig = px.line(df, x=x_col, y=y_col)
                                                    elif chart_type == "Scatter":
                                                        fig = px.scatter(df, x=x_col, y=y_col)
                                                    else:
                                                        fig = px.histogram(df, x=x_col)
                                                    st.plotly_chart(fig)
                                                    # 数据过滤
                                                    if st.checkbox("Filter Data"):
                                                        threshold = st.slider(f"Filter {y_col} >", float(df[y_col].min()), float(df[y_col].max()))
                                                        filtered_df = df[df[y_col] > threshold]
                                                        st.write("Filtered Data:", filtered_df)
                                                

                                                说明:

                                                • 用户上传 CSV,选择图表类型和坐标轴。
                                                • 支持动态过滤数据并实时更新图表。

                                                  9. 资源与文档

                                                  • 官方文档:https://docs.streamlit.io/
                                                  • GitHub 仓库:https://github.com/streamlit/streamlit
                                                  • PyPI 页面:https://pypi.org/project/streamlit/
                                                  • 社区论坛:https://discuss.streamlit.io/
                                                  • 教程:
                                                    • Streamlit 官方教程:https://docs.streamlit.io/library/get-started
                                                    • DataCamp Streamlit 指南:https://www.datacamp.com/tutorial/streamlit
免责声明:我们致力于保护作者版权,注重分享,被刊用文章因无法核实真实出处,未能及时与作者取得联系,或有版权异议的,请联系管理员,我们会立即处理! 部分文章是来自自研大数据AI进行生成,内容摘自(百度百科,百度知道,头条百科,中国民法典,刑法,牛津词典,新华词典,汉语词典,国家院校,科普平台)等数据,内容仅供学习参考,不准确地方联系删除处理! 图片声明:本站部分配图来自人工智能系统AI生成,觅知网授权图片,PxHere摄影无版权图库和百度,360,搜狗等多加搜索引擎自动关键词搜索配图,如有侵权的图片,请第一时间联系我们。

相关阅读

目录[+]

取消
微信二维码
微信二维码
支付宝二维码